How to Speed Up a Heavy Web App
Optimize web app performance: Web Workers, WebP, OPFS, content-visibility, React Compiler tips. Speed up document scanning & image processing. Learn how!


Honestly, there’s nothing quite like the sinking feeling when your cool new feature, the one you poured weeks into, just… drags. Users get frustrated, clicks feel laggy, and sometimes the whole browser tab just gives up the ghost. I’ve been there. Many times.
One of my lasts projects is Scan Documents, an app that helps to digitize documents. The idea was simple enough on paper: let users upload images or PDFs, and then view and maybe manipulate the pages right in their browser. Cool, right? Except these weren't tiny little flyers; we're talking hefty documents, sometimes hundreds of pages long.
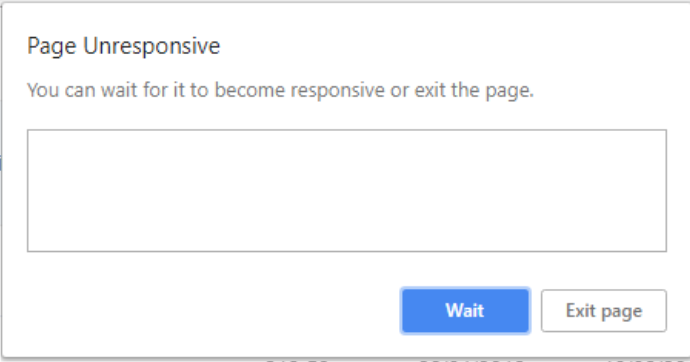
The core task involved was converting each PDF or Image page into an image client-side. And let me tell you, that first version? It wasn't pretty. I hit the performance wall, hard. UI freezes, massive memory spikes, endless loading skeletons, and finally Google Chrome "Page does not respond" screen.
But hey, that's part of the fun, isn't it? Solving puzzles. This post is basically my story, sharing the practical steps I took, the tricks I learned, to pull that application out of the mud and get it running smoothly. Ready? Let's get into it.
What Was Really Slowing Things Down?
So, picture this: a user uploads a 150-page PDF. Our app needs to show each page as an image. The initial, naive approach was basically: grab the PDF, loop through the pages, use a library (like pdfium) to render each page onto a canvas, convert that canvas to an image (maybe a PNG), and slap it into the DOM.
Why was this so bad?
- The Main Thread Chokehold: JavaScript, as you know, usually runs on a single main thread. This thread handles everything – running your code, painting the screen, responding to user clicks. When you ask it to do heavy computation, like parsing a big PDF and rendering dozens of complex pages into images, it gets completely tied up. Result? The UI freezes. Click a button? Nothing happens. Try to scroll? Good luck. It’s like trying to have a conversation with someone who’s busy solving a giant math problem in their head.
- Memory Monster: Raw image data, especially uncompressed stuff coming straight off a canvas, is HUGE. Loading hundreds of these into memory simultaneously? Your browser's memory usage goes through the roof. For users on less powerful machines or mobile devices, this often meant the browser tab would just crash!
- DOM Overload: Even if you managed to generate the images, trying to render hundreds or thousands of
<img>elements at once is a recipe for disaster. The browser struggles to lay out and manage that many distinct items, making scrolling jerky or completely impossible.
I remember seeing initial load times stretching into minutes, not seconds, and watching the browser's task manager spike red. It was clear this approach wasn't just inefficient; it was fundamentally broken for the task. Something had to change.
Offloading the Heavy Stuff
The most obvious villain was that main thread blockage. If the heavy lifting is freezing the UI, the logical step is… don't do the heavy lifting on the main thread! This is exactly what Web Workers are for.
Think of a Web Worker like hiring an assistant who can work in a separate room (a separate thread). You can give them a complex task, and while they're busy crunching numbers or, in our case, converting PDF pages, you (the main thread) are free to keep the shop running – updating spinners, responding to cancel buttons, keeping the UI smooth. Here is how I implemented it:
- The main thread gets the PDF file.
- It sends the file data over to a Web Worker. This is like handing off the paperwork to your assistant.
- The Worker receives the data, loads up the PDF library (yes, workers can run external scripts!), and starts processing the PDF page by page. It renders a page, converts it to the image format we need (we’ll get to which format later).
- Crucially, the Worker sends results back incrementally. Maybe it sends back image data for page 1, then page 2, etc., along with progress updates (we'll see that sending the image data was not the best thing later).
- The main thread listens for these messages and updates the UI accordingly – showing a thumbnail.
The difference was night and day. The UI stayed perfectly responsive. Users could see progress happening, and importantly, they could still interact with other parts of the app. Web Workers were the first big win.
Don't Draw What You Can't See
Okay, so we weren't freezing the UI anymore during processing. But we still had the problem of potentially hundreds of generated images. Trying to show them all at once was still a no-go. If you have 500 pages, you don't need all 500 images loaded and rendered in the DOM right away, right? You only care about the few visible on the screen, plus maybe a few above and below for smooth scrolling.
This is where list virtualization comes in. The core idea is simple: only render the items that are actually in or near the user's viewport.
Now, you could reach for JavaScript libraries that handle this. They typically calculate which items should be visible based on scroll position and container size, and then manually add and remove DOM elements. They work, but they add complexity and can sometimes be tricky to get right.
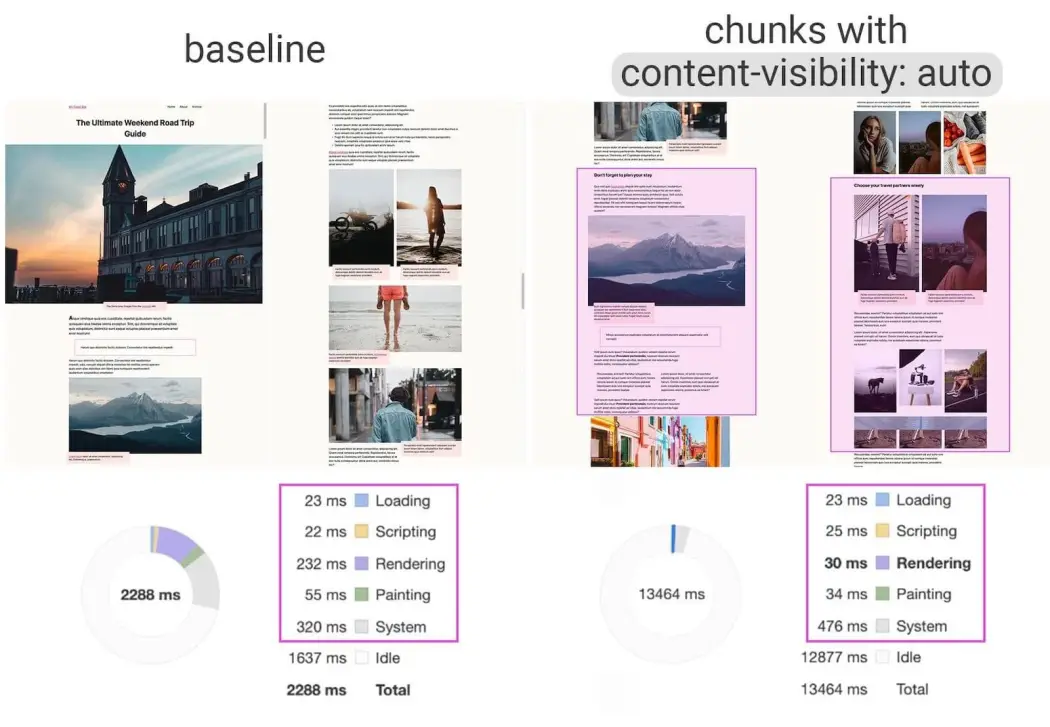
But here’s the cool part: the browser is getting smarter! There's a relatively new CSS property called content-visibility. Setting it to auto on the elements that contain your pages does something amazing.
.document-page-container {
  content-visibility: auto;
  contain-intrinsic-size: 800px 1100px; /* Approx. page height/width */
}
Let me explain: content-visibility: auto basically tells the browser, "Hey, you don't need to worry about rendering the content of this box if it's not currently on screen." The browser skips the rendering work (painting, layout) for off-screen elements, which is a massive performance save.
The contain-intrinsic-size part you can use it to define the layout. It gives the browser a hint about the element's size before it renders the content. Without it, the scrollbar might jump around weirdly as things load in, because the browser doesn't know how much space the off-screen content will eventually take up. You just give it an estimated width and height, or do not use it.
Using content-visibility: auto felt almost like cheating. With just a couple of lines of CSS, scrolling through hundreds of pages became incredibly smooth comparing to the over complex virtualization libraries in npm.
Optimize Images
I already had background processing and smart rendering done. But remember that memory monster? Even if we were only rendering a few images at a time, generating potentially hundreds of PNGs or JPEGs still consumed a ton of memory, both in the worker creating them and on the main thread when displaying them. Plus, if we ever needed to store them temporarily or send them around, those big file sizes were painful.
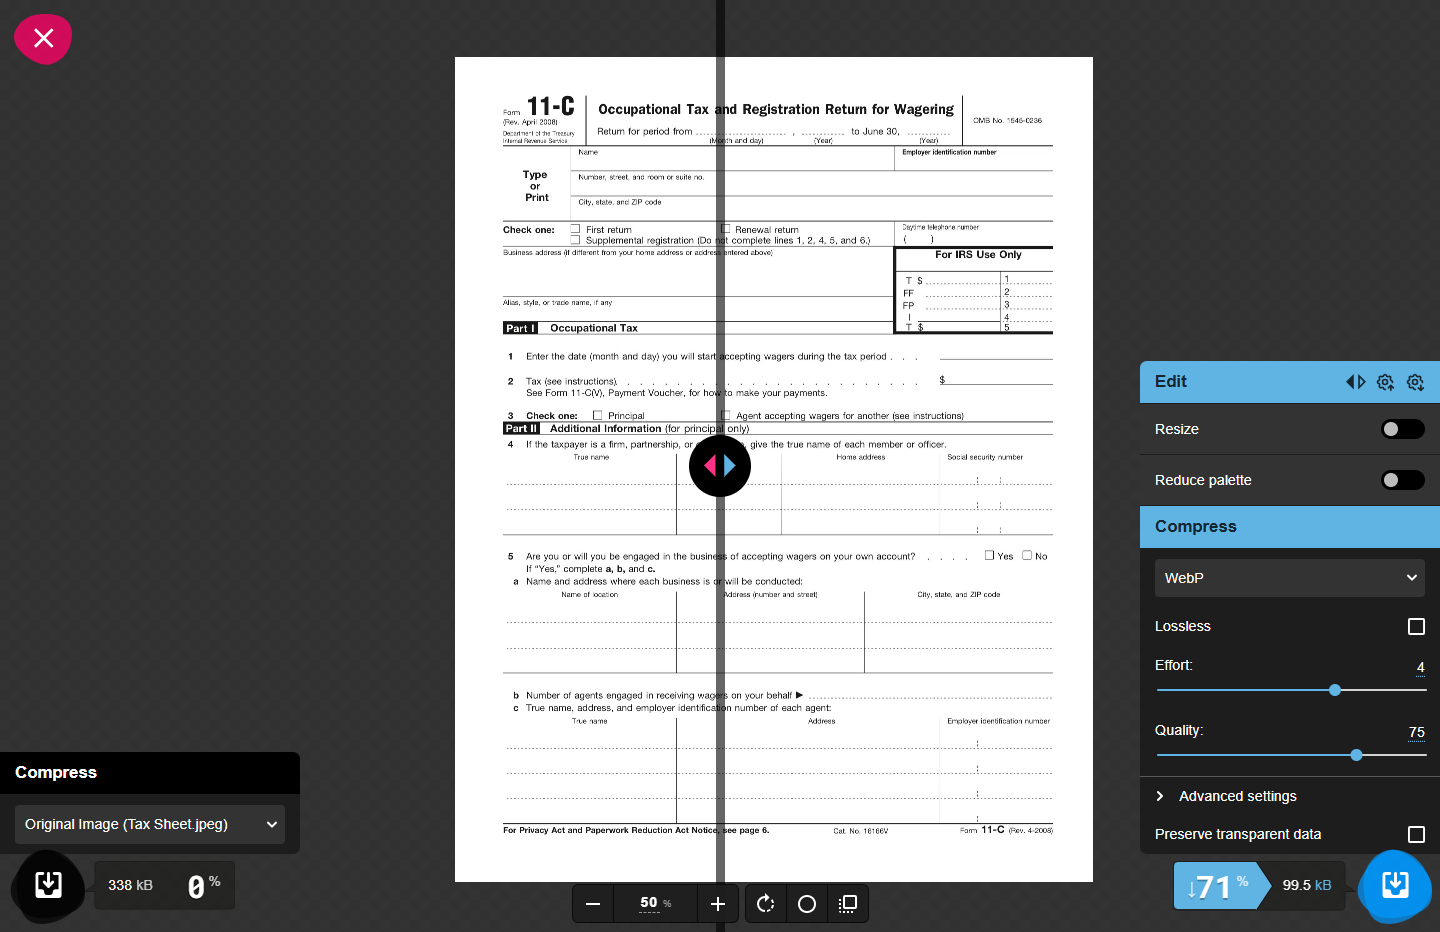
Enter WebP. It's a modern image format developed by Google that offers much better compression than traditional formats like JPEG and PNG, for both lossy and lossless images. Smaller file size means less memory usage, less bandwidth (if sending over a network), and often faster decoding/display times.
So, inside our Web Worker, after rendering a PDF page to a canvas, instead of exporting it as a PNG using canvas.toDataURL('image/png'), I switched to WebP:
// Converting the bitmap data into a webp image
await canvas.convertToBlob({ type: "image/webp" });
The difference in file size was significant, often reducing image data volume by 50% or more compared to PNG, without a noticeable drop in visual quality. This directly translated to lower memory consumption across the board. It just made everything lighter and more manageable.
Offload Memory Usage to Disk
Now things were getting pretty optimized. But a new challenge emerged. We had our Web Worker churning out these lovely, lightweight WebP images (as Blobs). How do we get them efficiently to the main thread for display, or maybe even share them between multiple workers if we decided to parallelize page processing?
The standard between workers and the main thread is great, but when you send large data like image Blobs, the browser often has to copy or serialize that data. This can still be slow and memory-intensive, especially if you're dealing with many images. I needed a way to share the data without expensive copying.
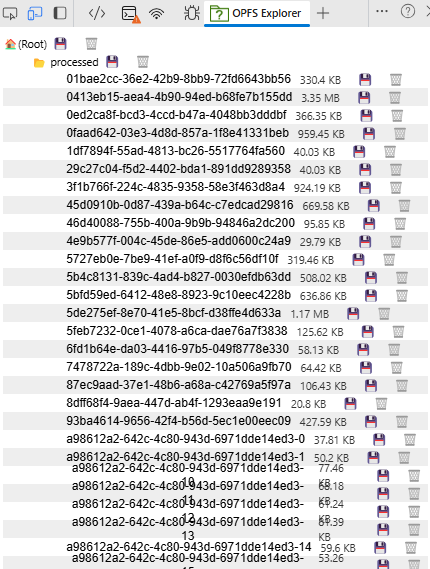
This led me to the Origin Private File System (OPFS). This is a newer browser API that gives your web application access to a private, sandboxed file system tied to its origin (your website's domain). Think of it like a small, fast, private hard drive just for your site that the browser manages.
Here’s the workflow I adopted:
- The Web Worker generates the WebP image Blob for a page.
- Instead of sending the Blob data directly, the worker writes the Blob to a file in the OPFS. It gets a handle or a path to this file.
- The Worker then sends just the reference (a internal uuid I assigned the documents) back to the main thread. This message is tiny!
- When the main thread needs to display page 5 (perhaps because it scrolled into view), it uses the filename to read the file directly from the OPFS and gets the Blob back.
Why was this better?
- No Costly Copying: We're passing tiny string references instead of large binary data.
- Efficient Sharing: If you had multiple workers, they could all potentially read/write to this shared OPFS space (with careful coordination, of course).
- Potential Persistence: Data in OPFS can persist between sessions, though we mainly used it for temporary storage during a single session.
- Memory Usage: We only charge the images on memory when we need them instead keeping them there.
OPFS was a game-changer for handling the generated assets efficiently. It acted like a high-speed temporary cache accessible across different parts of our application without clogging the communication channels or ballooning memory.
Don't Forget Global References
Okay, a quick but crucial one. When you have Blobs (like our WebP images) and you want to display them in an <img> tag, a common way is using URL.createObjectURL(blob). This generates a special temporary URL (like blob:http://.../uuid) that the <img> tag can use as its src.
const imageUrl = URL.createObjectURL(imageBlob);
imgElement.src = imageUrl;
Sounds simple, right? But here's the catch that many people does not know: these Object URLs hold a reference to the Blob data in memory. The browser doesn't automatically know when you're done with them. If you keep creating these URLs (e.g., every time a page scrolls into view) and never clean them up, you create a memory leak. The memory usage just keeps climbing because the browser is holding onto all those old Blobs.
The solution is simple but vital: URL.revokeObjectURL(imageUrl). You need to call this when you no longer need the Object URL.
When exactly? It depends, but common places are:
- After the image has successfully loaded
(imgElement.onload = () => { URL.revokeObjectURL(imageUrl); }). - In React, often in the useEffect cleanup function when the component unmounts or the src changes.
useEffect(() => {
  if (!imageBlob) return;
  const imageUrl = URL.createObjectURL(imageBlob);
  imgElementRef.current.src = imageUrl;

  // Cleanup function:
  return () => {
    URL.revokeObjectURL(imageUrl);
    imgElementRef.current.src = ''; // Clear src just in case
  };
}, [imageBlob]);
Being diligent about revoking these URLs stopped those slow, creeping memory leaks and made the application much more stable over longer user sessions. It’s like remembering to close your browser tabs when you’re done with them!
Trying the React Compiler
Even with all these optimizations, complex UIs can still suffer from unnecessary re-renders. In React, we often spend a fair bit of time manually optimizing components with React.memo, useMemo, and useCallback. It works, but it adds boilerplate code and it's easy to miss spots or get the dependencies wrong.
This led me to experiment with the (still experimental!) React Compiler. The promise of the compiler (developed by the React team) is that it can automatically figure out which parts of your components need memoization and apply those optimizations during the build process. The goal is to get great rendering performance by default, without littering your code with manual memoization hooks.
The Potential Benefit: Cleaner code, potentially better performance because the compiler might catch things a human would miss, and less mental overhead worrying about optimizing every little thing.
Important Caveat: As I write this, the React Compiler is still experimental. It might have bugs, edge cases, or change before it's officially stable. It's definitely something to keep an eye on and maybe try in non-critical projects or branches, but perhaps not bet the farm on just yet for production. Still, it represents an exciting direction for framework-level performance optimization.
Bringing It All Together
None of these strategies worked in isolation. The real magic happened when they started working together:
- Web Workers took the heavy image processing off the main thread.
- They generated lean WebP images.
- These images were stored/shared efficiently using OPFS.
- content-visibility ensured the browser only rendered the few visible pages.
- Object URL revocation kept memory usage in check.
- And experiments with the React Compiler aimed to streamline UI updates even further.
It was like tuning different parts of an engine. Optimizing just one part helps a little, but getting them all working harmoniously makes the real difference.
What Did I Really Learn?
Looking back at that project and others like it, a few key ideas stand out:
- Measure First, Optimize Later: Don't guess where the bottleneck is. Use browser developer tools (Performance tab, Memory tab) to find out what's actually slow before you start changing things.
- Use the Platform: Modern browsers have powerful built-in tools! Web Workers, smarter CSS like content-visibility, OPFS – learn them and use them. Don't always reach for a library first.
- Memory Matters: Especially on the web, be mindful of how much data you're loading and holding onto. Clean up after yourself (like with Object URLs).
- Assets are Key: Optimize your images, scripts, and styles. Smaller assets load faster and use less memory. WebP was a huge win here.
- Keep the UI Alive: Anything computationally expensive needs to get off the main thread. Users forgive a short wait with a progress bar; they don't forgive a frozen screen.
- Keep Learning: The web platform evolves fast. New APIs, new CSS features, new tools like the React Compiler pop up all the time. Staying curious is part of the job.
The Bottom Line
Turning that sluggish document viewer into something fast and responsive was incredibly satisfying. It took digging into browser internals, experimenting with different APIs, and thinking holistically about the entire process, from data loading to rendering.
The strategies I shared aren't silver bullets for every single performance problem. But for applications wrestling with large amounts of data or complex client-side processing, they offer a powerful toolkit.
Hopefully, sharing my experience gives you some ideas for your own projects. Performance optimization can feel like a dark art sometimes, but often it just comes down to understanding the bottlenecks and applying the right tools methodically.

If you enjoy the content, please don't hesitate to subscribe and leave a comment! I would love to connect with you and hear your thoughts on the topics I cover. Your feedback is greatly appreciated!